## [2022-7-24 Classification of Japanese Verbs](#japanese-verb-classification)
We're taught there are two main types of verb in Japanese: godan verbs (五段動詞, godan-dōshi) and ichidan verbs (一段動詞, ichidan-dōshi).
We're also taught that there are exceptions: suru verbs (する) and kuru (来る).
The distinction is important because the way you conjugate a verb depends on which type it is.
This can be a source of frustration for Japanese language learners because some godan verbs look like ichidan verbs and vice-versa.
If you get it wrong, your Japanese will sound wrong when you try to conjugate those verbs.
I wondered whether some statistical analysis could help me understand how the different types of verbs (and exceptions) are distributed.
I looked at the top 1,800 verbs from a statistical standpoint. The results were interesting and useful to me so I thought I would share them.
I hope this can be useful to some other people.
### Cheat sheet for classifying Japanese verbs
This diagram describes how I mentally classify a Japanese verb that I haven't yet learned.
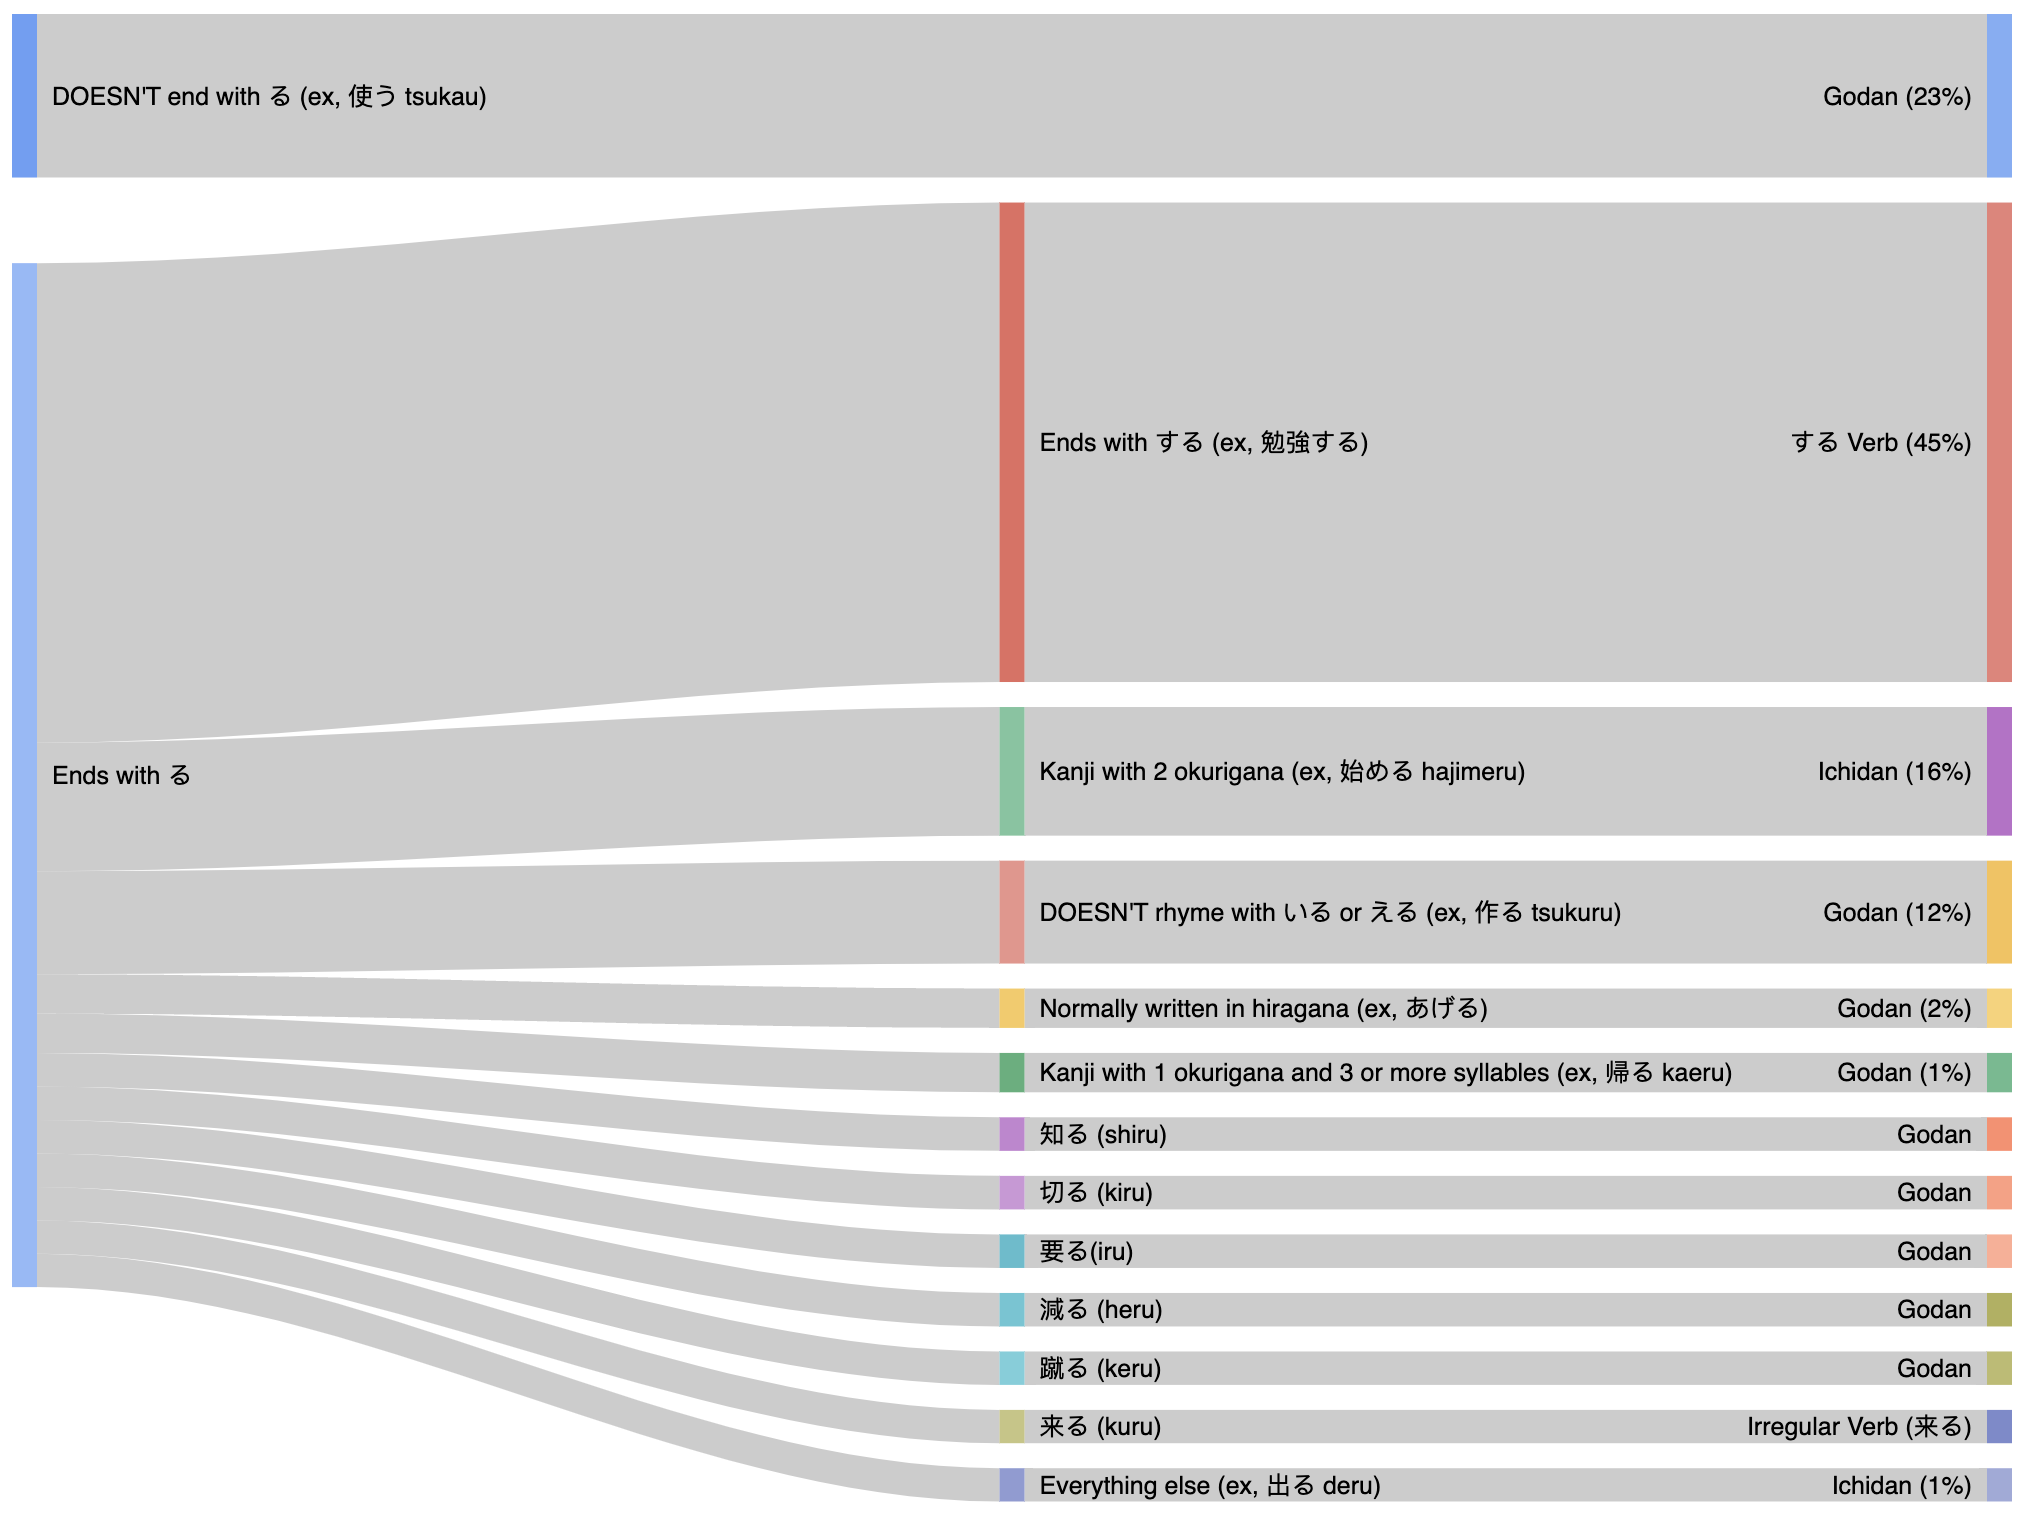
The relative thickness of the lines reflect the frequency of each case (rounded up to 1% thickness for legibility).
Let's dig in to the statistics of each of the rules above.
### Rule: Verbs that DON'T end in る are godan verbs (ex, 使う tsukau)
There are only 9 hiragana that a Japanese verb can end with:
u (う), ru (る), tsu (つ), su (す), ku (く), gu (ぐ), nu (ぬ), mu (む), and bu (ぶ)
| Last Kana | Frequency | Count | Last Kana | Frequency | Count |
| --------- | --------- | ----- | --------- | --------- | ----- |
| る | 76.8% | 1381 | ぐ | 0.9% | 17 |
| す | 8.2% | 147 | つ | 0.8% | 15 |
| く | 4.7% | 85 | ぶ | 0.7% | 12 |
| う | 4.2% | 75 | ぬ | 0.1% | 1 |
| む | 3.7% | 66 |
As you can see, by far, most verbs end in ru (る). This is a big part of the trouble distinguishing verb types because verbs that end in ru (る) can be godan, ichidan, or one of the exceptions.
However, all the other verbs are definitely godan verbs. Added together, these verbs account for about 23% of verbs.
After applying this rule, we only need to worry about ru (る) verbs.
### Rule: Verbs ending in する are suru verbs (ex, 勉強する)
The verbs we're left with now all end in ru (る). However, a very large portion of these end in suru (する).
| Ending | Frequency | Count |
| ------ | --------- | ----- |
| する | 61% | 844 |
| non-する | 39% | 537 |
This is great because all of those verbs are suru verbs.
### Rule: 来る (kuru) is irregular
You just have to memorize this one. 来る conjugates irregularly and is very common.
### Rule: Verbs that DON'T rhyme with iru (いる) or eru (える) are godan (ex, 作る tsukuru)
If the end of the word doesn't rhyme with (いる) or eru (える) then it is godan. Note that the i (い) or e (え) can come from kanji and not just hiragana.
This kind of godan verb makes up about 12% of all verbs.
### Rule: Verbs with one kanji with 2 okurigana are ichidan (ex, 始める hajimeru)
From here on, we have to look at the whole word rather than just its ending. We need to know things like:
- Does it have kanji.
- How many syllables are in the kanji.
- How many okurigana (送り仮名) are there? Okurigana are the hiragana at the end of a verb.
About 16% of all verbs are built from one kanji, with one syllable, followed by two okurigana. All of these are ichidan.
### Rule: Verbs usually spelled with only hiragana are godan (ex, あげる)
This one is a bit tricky since these verbs are still based on kanji and you may even occassionally find them spelled with those kanji.
About 2% of verbs fit this rule.
### Rule: Verbs with kanji, 1 okurigana, and 3 or more syllables are godan (ex, 帰る kaeru)
About 1% of verbs fall in this category. However, some (like 帰る) are commonly used.
### Rule: 知る (shiru), 切る (kiru), 要る (iru), 減る (heru), and 蹴る (keru) are godan
These are just exceptions you have to memorize. All of these verbs have one kanji and two syllables.
I don't know why these words are this way, but it may be that if they were ichidan then some of their
conjugations would lead to confusing overlaps with more common words.
For example, if 知る (shiru) was ichidan, then its ます (masu) form would be pronounced します (shimasu)
and that would conflict with every suru (する) verb. Because it is godan, 知る's actual masu form is
しります (shirimasu).
Is this the real reason? I don't know. If you do know, please let me know.
### Rule: Everything else is ichidan (ex, 出る deru)
All remaining verbs (about 1%) are ichidan. These should all have one kanji, two syllables, and end in ru (る).
And that's the end. To my knowledge, the above rules are complete (100% fit) with the top 1,800 verbs.
## [2020-1-12 Single variable gradient descent linear regression in Kotlin](#linear-gradient-descent)
This is a highly commented reference implementation for single variable linear regression written in Kotlin.
```Kotlin
/**
* This function fits a line to the set of [points] by minimizing the sum of the squares of the errors from the
* resulting line to each point along the y axis.
*
* It iteratively updates a guess line (m and b) by adding a small increment to each in the direction of the
* gradient of the cost function times [learningRate]. When the error reaches less than [maxError] the function
* returns the current guess line (m and b).
*
* The x value in points is the independent variable and the y value is the dependent variable. For example,
* x could be a movie's rating on IMDB and y could be its revenue.
*/
private fun leastSquareGradientDescent(
points : List<Pair<Double, Double>>,
maxError : Double = 1E-20,
learningRate: Double = 0.003) : Pair<Double, Double> {
// Scale the learning rate and the max error to the size of the data set.
val scaledMaxError = maxError * points.size
val scaledLearningRate = learningRate * points.size
// m and b form the current guess line which will be iteratively updated.
var (m, b) = 0.0 to 0.0
// The current cost.
var cost = Double.MAX_VALUE
// Function that returns the y-distance from the given point to the current guess line.
fun dist(x : Double, y : Double ) = m * x + b - y
while(cost >= scaledMaxError) {
// The derivative of the cost function with respect to m (b is constant)
val mGradient = points.map { (x, y) -> dist(x, y) * x }.sum()
// The derivative of the cost function with respect to b (m is constant)
// It is also the sum of the y distances from each point to the guess line.
val bGradient = points.map { (x, y) -> dist(x, y) }.sum()
// Update the guess in the direction of gradients scaled by the learning rate.
m -= scaledLearningRate * mGradient
b -= scaledLearningRate * bGradient
// Check cost and see if it is less than the request max error
cost = points.map { (x, y) -> dist(x, y) * dist(x, y) }.sum()
}
// Hit max iterations without meeting max error condition.
return m to b
}
```
The purpose is to show gradient descent from first principles.Actual single variable linear regression would use the closed form:
```Kotlin
val m = covariance / variance
val b = meanY - m * meanX
```
## [2019-3-19 Packaging wrap.sh into APK with Android Studio](#wrap.sh)
When debugging and profiling apps with native code, it’s often useful to use debugging tools that need to be enabled at process startup.
Examples include:
* Tracing system calls with strace.
* Finding memory bugs with malloc debug or Address Sanitizer (ASan).
* Profiling with Simpleperf.
The way to do this is with wrap.sh which is documented [here](https://developer.android.com/ndk/guides/wrap-script).
What's not clear is how to get wrap.sh into your APK at the correct location. The trick is to add it into an ABI-specific resources folder in your Android Studio project:
So,
* src/main/resources/lib/x86/wrap.sh
* src/main/resources/lib/x86_64/wrap.sh
* etc.
Now, when you build your APK, those files will be placed in the proper subfolders.

## [2019-1-3 Machine Learning for Self Reflection](#reflect)
I study Japanese as a hobby. I'm not good at it but it makes me happy and I find it relaxing. Over the recent holiday this hobby suddenly overlapped with my interest in machine learning when I realized ML can be used to model and visualize my own mental processeses. **The result is a kind of algorithmic introspection**.
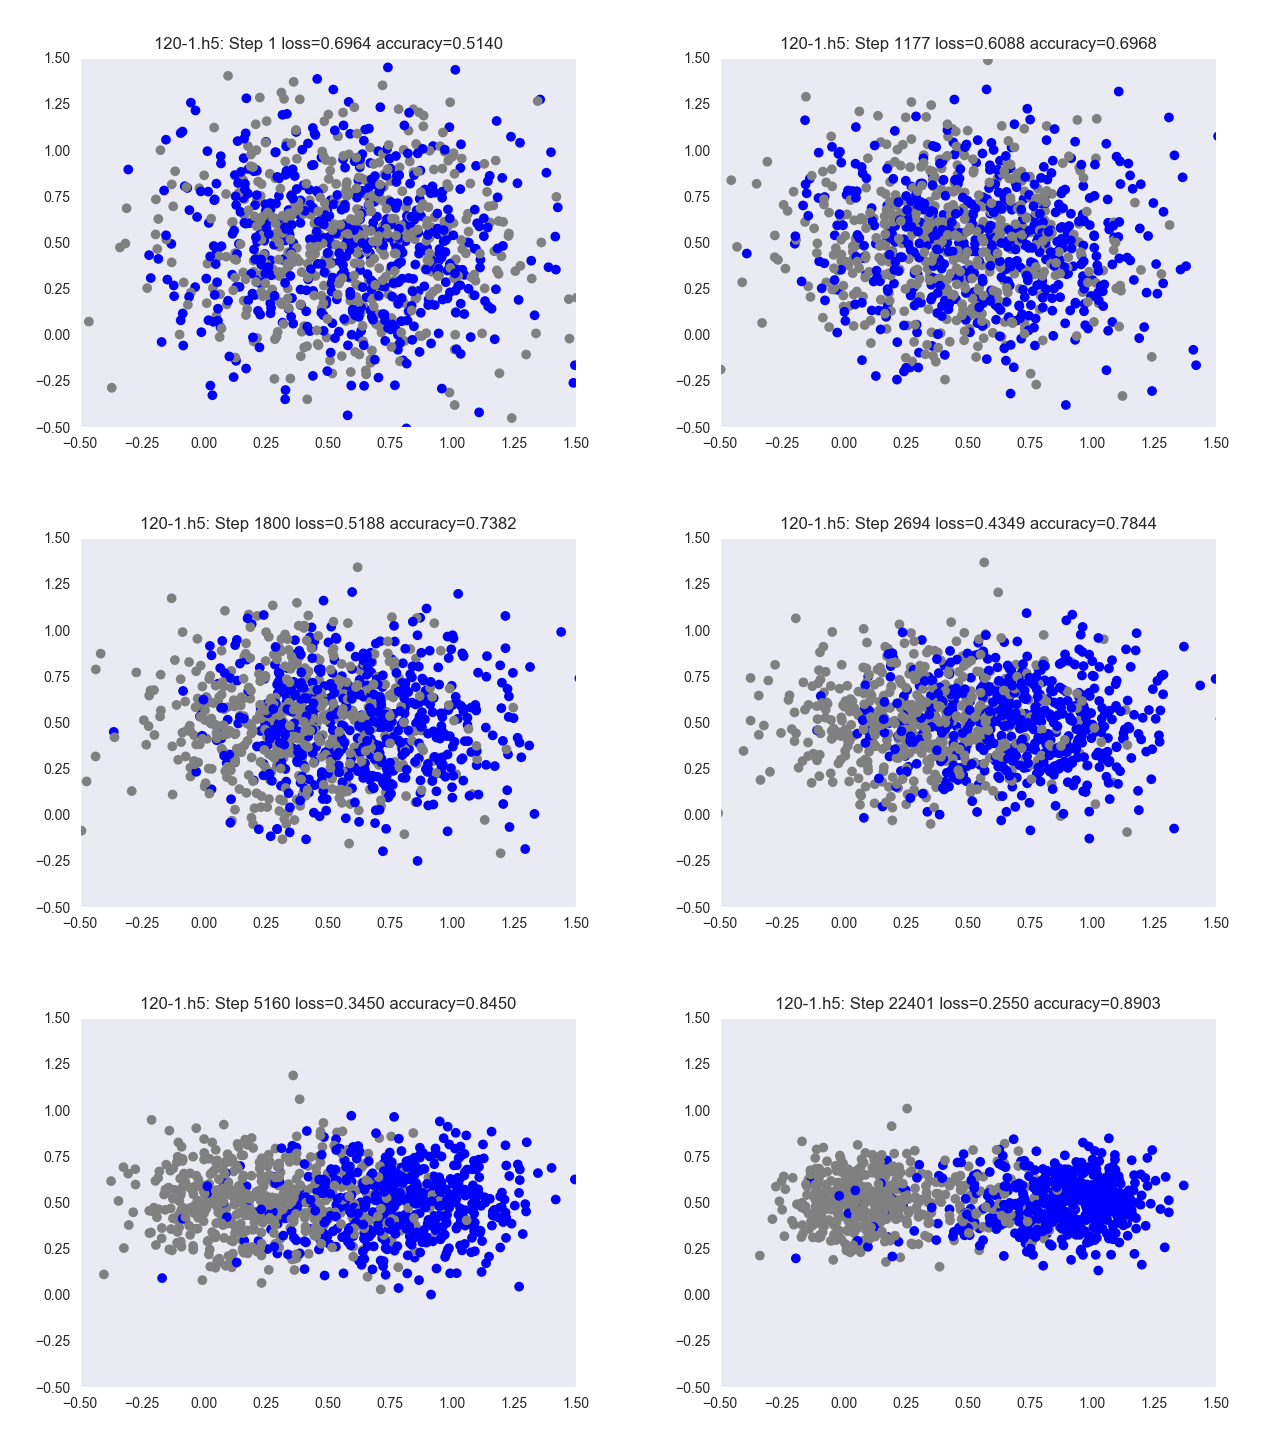
This graph shows a neural network as it learns to predict when I will forget particular facts I've learned about Japanese.
```
- Each dot is a quiz
- Blue dots I answered correctly
- Grey dots I answered incorrecty
- The animation shows the prediction the model makes about whether I will answer correctly or not
- A dot on the left side means the model predicts I will answer incorrectly
- A dot on the right side means the model predicts I will answer correctly
```
### The Joy of Kanji
Part of learning Japanese is the daunting task of memorizing the meanings of 2136 commonly used logographic characters known as jōyō kanji (常用漢字). For example,
```
常 - Normal pronounced じょう/jō
用 - Use pronounced よう/yō
漢 - Chinese pronounced かん/kan
字 - Character pronounced じ/ji
```
I've used various tools over time to help me with this task and the most helpful to me has been [Wanikani](https://wanikani.com).
This is basically a flashcard system where I am prompted with kanji and I'm required to write it's meaning or pronunciation.
I've used Wanikani for more than a year and have learned nearly 1000 kanji to varying levels of competency.
### Spaced Repetition System (SRS)
After a while I became curious about how Wanikani worked under the covers.
I could tell the system was trying to figure out some kind of good order. It often didn't quiz me on kanji that I knew pretty well and it quizzed me more often on the kanji that I struggled most with.
How does Wanikani decide which kanji to test me on next? It is optimal in some way?
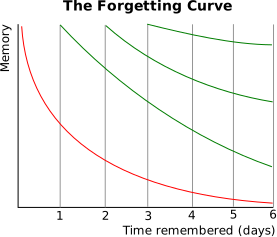
This led me to the personal discovery that there is a fairly sophisticated science behind this kind of thing. It's called SRS (Spaced Repitition System) if you want to search more about it. The main model they use is that when you learn something there is an increasing chance you will forget it over time.
> 
> _- uploaded by Icez at English Wikipedia, Public Domain_
Each time you review the material the forgetting curve gets more shallow until eventually it will decay slowly enough to last the rest of your life.
### Quirks and Rough Edges
> All models are wrong; some models are useful.
> -George Box, 1976
After more than a year with Wanikani I had become familiar with it's quirks and rough edges.
- Once it became convinced I had learned ("Burned") something completely it would stop quizzing me altogether. However, there were some that I knew I was going to forget later.
- On the other hand, I noticed sometimes when I was really bad on a particular case it would seem to give up. But I would have preferred to be quizzed more often so that I had a better chance of learning.
- The spacing between repititions seems to be a hard-coded increasing pattern. But surely my optimal spacing would be different from someone elses. For example, a native Chinese speaker may be able to go faster because they grew up in an environment with logographic characters.
### Are Other Models Useful?
I wondered about a different model of forgetting where there is a precise moment that you forget rather than a probability curve.
Maybe the curve in the forgetting curve model is about the model's uncertainty about whether you will remember something rather than an accurate reflection of the biological process of forgetting.
**I became curious about whether a neural network could learn the forgetting curve.**
Wanikani is a great platform and it even has an API that you can use to query your quiz history. I used this to capture a set of tuples:
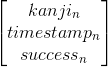
Since it is a time-series my first thought was to use LSTM to model it. Maybe this is possible but I couldn't figure it out. The problem I had is that LSTM is typically for fixed time windows but the time span between quizzes is variable.
Instead, I tried this as the input to the model:
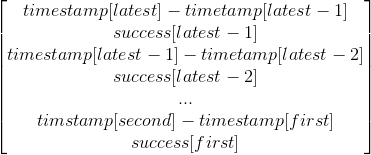
Where the output trained for is success[latest].
Some notes about the inputs:
- I removed the kanji ID from the input set altogether. The reason is that I think it would help the model too much since the data are for a single person (me). If I had a lot of people's history I might be inclined to put it into the model. The other reason is that it would limit the usefulness of the model to me for future kanji.
- Since this is a time-series there are a variable number of quizzes for each kanji. In fact, I had one kanji that I had quizzed 110 times and still hadn't learned!. I initially backfilled the remaining parts with zero but later found a way to improve on this.
- A single input is constructed for each quiz (not each kanji) so the same data is repeated with for different time offsets. I was initially worried that this might help the model too much because the answers were embedded in the inputs. I don't think this turned out to be a problem because the resulting model is able to predict answers that it doesn't have access to.
- The data is highly skewed in that I have about 90% success rate in answering quizzes. So initially, the model would just choose an answer close to .9. This wasn't helpful so I balanced the successes with the failures by duplicating the failures nine times.
In the end, the input had size 60. I used a two layer neural network with 30 needs in the first layer and one node in the output layer. I was hoping for a smaller network but I found smaller one's didn't train as well.
### Conclusion
I think it worked in the sense that I have a network that can predict when I will forget a particular item given the history of that item. I'm still trying to figure out the right way to visualize the forgetting curve based on this model. I'll post it here when I do.
To me, the eye opening thing is that I can model a part of my mental process and show it to you. Until now, I had thought my mind was a black box to anyone besides myself (and usually a black box even to me). I feel like this might lead somewhere interesting.
#### 2015-6-21 Some Matrix and Vector Functions
Here is a function to create a vector and another to create a transposed vector in TypeScript
```typescript
function matrix(height, width, fn) : number[][] {
return range(height,
i=>range(width,
j=> fn(i, j)))
}
function vector(height, fn) : number[][] {
return matrix(height, 1, (i,j) => fn(i))
}
function vectort(width, fn) : number[][] {
return matrix(1, width, (i,j) => fn(j))
}
```
Examples,

Javacript output: [ [ 0 ], [ 2 ], [ 4 ], [ 6 ], [ 8 ] ]

Javacript output: [ [ 0, 2, 4, 6, 8 ] ]

Javascript output: [ [ 0, 0, 0 ], [ 1, 1, 1 ], [ 2, 2, 2 ], [ 3, 3, 3 ] ]
Here is matrix dot product in TypeScript. It requires the 'range' function defined earlier.
```typescript
// TypeScript matrix dot product
// by Jomo Fisher
function dot(a:number[][], b:number[][]) : number[][] {
console.assert(a[0].length == b.length, "%s wrong dimension for %s", a, b)
return matrix(a.length, b[0].length,
(i, j) => range(a[0].length, k => a[i][k] * b[k][j])
.reduce((p, c)=> p + c, 0))
}
```
#### 2015-6-19.1 Multivariable Logistic Regression
I showed linear regression in TypeScript a few days ago. Logistic regressions is very similar, all that is required is a transformation of the hypothesis equation to 1/(1 + exp(-z)) where z is the old linear expression. The result is a number in [0,1]. Logistic regression can be viewed as a single neuron in an artificial neural network.
Intuitions:
- The new hypothesis function is a sigmoid. It squashes the answer into a range.
- Not all hypothesis functions have gradient descent solutions that work in the same form
```typescript
/ TypeScript multivariable logistic regression using gradient descent
// - y is 0 or 1
// by Jomo Fisher
function logistic(y : number[], x : number[][], iterations : number) {
var [xnorm, μ, σ] = normalize(x)
x = xnorm.map(a=>[1].concat(a))
var m = x[0].length
var sum = f => y.reduce((s,_,i) => s + f(i), 0)
var Θ = range(m, _ => 0)
var h = i => 1 / (1 + Math.exp(-Θ.reduce((p, c, j) => p += c * x[i][j], 0)))
var α = 0.01 / m
range(iterations, _ =>
Θ = Θ.map((Θj, j)=>
Θj - α * sum(i=>(h(i) - y[i]) * x[i][j])))
return (...arr) => 1 / (1 + Math.exp(-arr.reduce((p, c, j) =>
p + Θ[j + 1] * (c - μ[j]) / σ[j], Θ[0])))
}
```
#### 2015-6-19 Converting from Binary to Gray Code
There is a simple conversion from binary to gray code.
```typescript
function graycode(n) {
return n ^ (n >> 1)
}
```
```text
0 => 0
1 => 1
2 => 3
3 => 2
4 => 6
5 => 7
6 => 5
7 => 4
8 => 12
9 => 13
10 => 15
11 => 14
12 => 10
13 => 11
14 => 9
15 => 8
```
#### 2015-6-14 Multivariable Linear Regression using Gradient Descent
Simple multivariable linear regression in type script.
- y is the desired output
- x is the input features (one feature type per column)
- μ are the means of features
- σ are the standard deviations of features
- Θ is the set of parameters to the model. This is what is trained.
- α is the update scale
- h is the training hypothesis
The return value of the linear() function is a function that can be called to execute the model against the trained parameters.
Intuitions:
- Training data with different units need to be normalized
- Set up a system of equations to minimize (a cost function)
- Can use gradient descent to minimize iteratively
- Multivariable linear regression is a generalization of least squares fit which is a generalization of interpolation
```typescript
// TypeScript multivariable linear regression using gradient descent
// by Jomo Fisher
function linear(y : number[], x : number[][], iterations : number) {
var [xnorm, μ, σ] = normalize(x)
x = xnorm.map(a=>[1].concat(a))
var m = x[0].length
var sum = f => y.reduce((s,_,i) => s + f(i), 0)
var Θ = range(m, _ => 0)
var h = i => Θ.reduce((p, c, j) => p += c * x[i][j], 0)
var α = 0.01 / m
range(iterations, _ =>
Θ = Θ.map((Θj, j)=>
Θj - α * sum(i=>(h(i) - y[i]) * x[i][j])))
return (...arr) => arr.reduce((p, c, j) =>
p + Θ[j + 1] * (c - μ[j]) / σ[j], Θ[0])
}
```
#### 2015-6-14 Feature Normalization
Various forms of multivariable regression perform much better when features are normalized. One method of normalization is to subtract the mean from each feature datum and then divide the result by standard deviation. This gives a result that is mostly between -2 and 2 with allowance for outliers.
Intuitions:
- Units are cancelled so the final regression result is also unitless
- Subtracting mean balances positive and negative
- Dividing by standard deviation normalizes scale (and cancels units)
```typescript
// TypeScript feature normalize. Feature data is in columns.
// by Jomo Fisher
function normalize(data : number[][]) {
var zeros = range(data[0].length, _ => 0)
var reduce = (data, fn) => data.reduce((p, c) => p.map(
(_,i) => fn(p[i], c[i])), zeros)
.map(s => s / data.length)
var map = (data, fn) => data.map(row => row.map(fn))
var μ = reduce(data, (p, c) => p + c)
var zeroed = map(data, (c, i) => c - μ[i])
var σ = reduce(zeroed, (p, c) => p + c * c).map(Math.sqrt)
return [map(zeroed, (c, i) => c == 0 ? 0 : c / σ[i]), μ, σ]
}
```
#### 2015-6-13.1 Range function
This range function is handy for writing concise TypeScript. It generates a dense array of size n and calls a function on each element.
```typescript
function range(high, fn) {
return Array.apply(0, Array(high)).map((_,i)=>fn(i))
}
```
#### 2015-6-13 Generate Permutations
Here's how to generate permutations of an array. The O(n!) nature is evident by the recursion inside a for-loop for decreasing n. There is one swap per iteration. The bit about n % 2 * i can be read as 'i when n is odd and 0 otherwise'.
```typescript
// TypeScript calls function for each permutation done by Heap's algorithm
function permute(n, a, f) {
if (--n == 0) return f(a)
var swap = m => {
var hold = a[m]
a[m] = a[n]
a[n] = hold;
}
for(var i = 0; i <= n; ++i) {
permute(n, a, f)
swap(n % 2 * i)
}
}
```
#### 2015-6-11 How to do Linear Interpolation (then Least Squares)
Given a line formed by [x1,y1] and [x2,y2] find the value y falling on that line for any given x.

```java
// Java implementation of linear interpolation from two points
double interpolate(double x, double x1, double y1, double x2, double y2) {
return ((y2 - y1) * (x - x1)) / (x2 - x1) + y1;
}
```
One way to generalize interpolation is through simple least squares regression. The following code for linear regression will degenerate to linear interpolation when there are only two points.
```typescript
// TypeScript implementation of least-squares fit (by Jomo Fisher)
function leastSquares(points) {
var sum = f => points.reduce((s,c) => s + f(c), 0)
var n = points.length
var mx = sum(p => p.x) / n
var my = sum(p => p.y) / n
var covariance = sum(p => (p.x - mx) * (p.y - my))
var variance = sum(p => (p.x - mx) * (p.x - mx))
var m = covariance / variance;
return {m : m, b : my - m * mx};
}
```
This is a cool snippet because it also includes the algorithms for variance and covariance.
#### 2015-6-9 How to Throttle on Client to a Certain QPS
Uses a control loop to settle at certain sleep rate.
```java
// Throttle QPS with Control Loop
private static Long longPeriodMillis = null;
private static long queries = 0;
private static double allowedQps = 20.0;
private static double delayMillis = 1000.0 / allowedQps;
@VisibleForTesting
public static void throttle() {
synchronized (global) {
++queries;
if (longPeriodMillis == null) {
longPeriodMillis = System.nanoTime();
return;
}
double longPeriodQps = queries / ((System.nanoTime() - longPeriodMillis) / 1000000000.0);
// This creates a feedback loop that will tune to the requested QPS
if (longPeriodQps > allowedQps) {
delayMillis *= 1.01;
} else {
delayMillis *= 0.99;
}
if (delayMillis > 1.0) {
System.out.printf("SleptEntity:%s for qps %s\n", delayMillis, longPeriodQps);
try {
Thread.sleep((long) delayMillis);
} catch (InterruptedException e) {
e.printStackTrace();
}
}
}
}
```
#### 2015-6-8 Learned how to embed formulas
Edit them here and get an html link: https://www.codecogs.com/latex/eqneditor.php


#### 2015-6-8 Reading The Bayesian Bootstrap
[https://projecteuclid.org/download/pdf_1/euclid.aos/1176345338]
The main cool trick here is to generate a set of n numbers in [0, 1] that add up to 1.0. Here are the steps:
(1) Generate n-1 random numbers in [0,1]
(2) Sort those numbers ascending
(3) Prepend 0 and append 1 to those numbers and call this list S
(4) Create a new set N where the i-th element is S[i+1] - S[i]
```typescript
// Bayesian bootstrap distribution generator in TypeScript
var n = 100;
var seed = Array.apply(0, Array(100));
var S : number[] = seed
.map(Math.random)
.sort();
S[0] = 0.0;
S.push(1.0);
var N = seed.map((_:any, i:number) => S[i+1] - S[i]);
```
Set N consists of numbers in [0,1] that sum to 1.0. Intuitively, this is similar to creating a random CDF (cumulative distribution function).
Bayesian bootstrapping involves creating many sets N and applying them as weights to each element of the sample population under consideration. Interpretation is that N[i] is probability that X[i] is in the bootstrap.
#### [2015-6-3 Reading The Practical Implementation of Bayesian Model Selection](#reading)
[https://www-stat.wharton.upenn.edu/~edgeorge/Research_papers/ims.pdf]